Salesforce Fundamentals: Part 5 - Reports & Dashboards
Published 26/09/2025 & Updated 29/05/2026

Salesforce data is only useful when people can see what is happening and decide what to do next. A clean data model and well designed automation create the records, but reports and dashboards turn those records into visibility, accountability, and action.
This is the moment Salesforce shifts from configuration into daily impact. Reports and dashboards are where the platform becomes a shared tool people rely on to understand performance and make better decisions.
This guide is for admins and developers who want to build reports and dashboards that actually work for people, whether you are starting with your first serious analytics or cleaning up a collection of ageing assets. You’ll learn how to turn Salesforce records into business answers, how dashboards bring those answers together for teams and leaders, and how to design analytics people can trust and use.
📊 Salesforce Reports
Section titled “📊 Salesforce Reports”A report is a reusable analytics query that turns Salesforce records into a business answer. It combines field selection, filters, groupings and summaries so teams can explore what is happening, why it is happening, and where they should take action.
A good report does more than list records. It:
- focuses attention on the right subset of data,
- groups and summarises to reveal trends and exceptions,
- calculates key metrics like totals, averages and percentages,
- surfaces results in charts or tables for faster decision-making,
- provides a trusted source for exports, dashboards and targets.
📁 Report formats
Section titled “📁 Report formats”- Tabular - simple list views.
- Summary - grouped with subtotals.
- Matrix - grouped by rows and columns.
- Joined - multiple report blocks side by side.
Pick the format based on the question you need answered, not personal preference.
📈 Salesforce Dashboards
Section titled “📈 Salesforce Dashboards”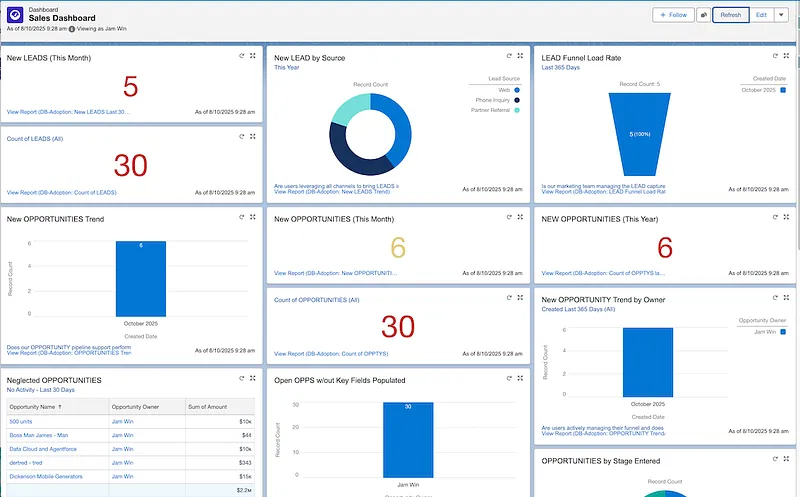
A dashboard is a page of components that turn analytics into immediate, visual insight. Each component is connected to a report, so dashboards are best used to monitor status, compare performance, and highlight where action is needed without forcing users into raw data.
Dashboards are ideal for role-based monitoring because they let teams see KPIs at a glance, compare trends across groups, and drill into the source reports when they need more detail.
From Spring ’26, dashboards can also embed Lightning Web Components (LWC), giving you a way to surface custom interactive visuals and logic directly alongside charts and tables. For setup details, see the Salesforce help guides on embedding LWCs in dashboards, LWC dashboard developer guidance, and adding LWC dashboard components.
🧩 Dashboard component types
Section titled “🧩 Dashboard component types”- Charts for trends and comparisons.
- Gauges for progress against targets.
- Metrics for single headline numbers.
- Tables for ranked details.
- Visualforce pages for legacy or bespoke dashboard content.
- Lightning Web Components (LWC) for custom visual interactions and embedded experience.
🧪 Practical Example: From Question to report to dashboard
Section titled “🧪 Practical Example: From Question to report to dashboard”Let’s walk through a simple but realistic scenario.
Imagine a sales manager who needs to know:
“Which opportunities are likely to close this quarter, and which ones need attention?”
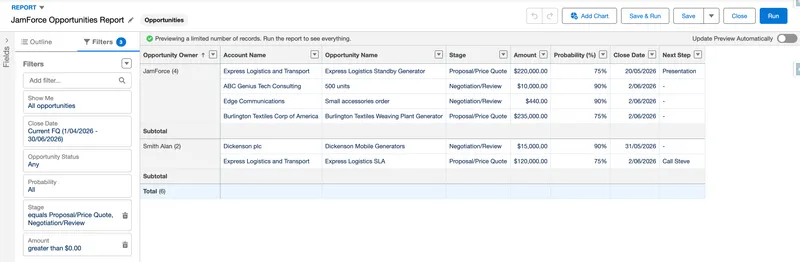
You’d start with a summary report:
- Object: Opportunity
- Filters: Stage in
Negotiation/RevieworProposal/Price Quote, Close Date = This Quarter, Amount > 0 - Grouping: By Sales Rep (Opportunity Owner)
- Columns: Account Name, Opportunity Name, Stage, Amount, Probability, Close Date, Next Step
From that report, you build a dashboard for the sales leadership team:
- A Metric component showing total pipeline for the quarter
- A Bar chart of opportunities by rep
- A Gauge showing percentage of quota achieved
- A Table listing the top 10 opportunities by amount
The report answers the detailed question. The dashboard gives leaders a quick health check and a way to drill into the source report when something looks off.
This pattern: question → report → dashboard is the core workflow for most Salesforce analytics, and it is strongest when it is built on a solid data model.
🛠️ Build Workflow: From Question to Dashboard
Section titled “🛠️ Build Workflow: From Question to Dashboard”The best analytics begin with a clear question and stay grounded in the people who will use them. Use this simple sequence to keep reports and dashboards practical, visible, and maintainable.
- Define the business question first.
- Build or refine the source report to answer that question.
- Add focused dashboard components that highlight the key insights.
- Validate with real users to make sure the output is actionable.
- Tune filters, sharing and folder access so the results are easy to find and use.
This approach keeps analytics useful and prevents dashboard sprawl.
⭐ Best practices
Section titled “⭐ Best practices”- Start with the business question. Build the report and dashboard around the decision you need to support, not the fields you can access.
- Keep analytics focused. Limit report columns and dashboard components to what is essential for the user story, then refine from there.
- Choose the right format. Match report type and dashboard component to the way people need to consume the data: lists for detail, charts for trends, metrics for signals.
- Design for the user. Make filters easy to use, set sensible default views, and verify the dashboard works for the intended audience.
- Document ownership and purpose. Give reports and dashboards clear names, descriptions, and owners so teams can maintain them confidently.
⚠️ Common pitfalls to avoid
Section titled “⚠️ Common pitfalls to avoid”These are the traps that most often undermine analytics work:
- Trying to cover every scenario in one report. Overloaded reports are slow to run and hard to interpret. Keep each report focused on a single question or process.
- Crowding dashboards with too much. A dashboard that tries to show everything usually ends up saying nothing clearly. Prefer a small set of meaningful components.
- Using the wrong execution context. Dashboards that always run as the builder can show users data they should not see or hide data they should. Use run-as settings appropriate to the audience.
- Leaving reports undocumented. Without purpose and ownership, analytics become brittle, duplicated, and neglected.
Following these practices makes reports and dashboards more reliable, easier to use, and easier to maintain.
🎯 Final Thoughts
Section titled “🎯 Final Thoughts”Reports and dashboards are where Salesforce proves its value to the wider business. When the right people can see the right metrics at the right time, Salesforce becomes more than a place to enter data; it becomes a shared view of performance, risk, and opportunity.
For me, this is the point where the platform stops feeling like setup work and starts feeling like designing how people actually operate. It moves from a technical project to a business conversation. It’s also the part I find most interesting, because small choices in report filters and dashboard layout can have a huge effect on how teams trust and use the data day to day.
🚀 Next steps
Section titled “🚀 Next steps”That trust always starts with the data. In Data Management, you’ll learn how to keep Salesforce clean, consistent, and reliable so the reports, dashboards, automation and future development all rest on information people can really believe in.