Salesforce Fundamentals: Part 3C - Reports & Dashboards
Published 26/09/2025

Salesforce data is only useful when people can see what is happening and decide what to do next. A clean data model and well designed automation create the records, but reports and dashboards turn those records into visibility, accountability, and action.
In this chapter, you’ll learn how Salesforce reports answer specific business questions, how dashboards bring those answers together for teams and leaders, and how to build analytics that people actually trust enough to use.
📊 Salesforce Reports
Section titled “📊 Salesforce Reports”A report is a structured, filterable view of records that match selected criteria.
Reports help you:
- filter and sort to focus on what matters,
- group records to reveal patterns,
- calculate totals and averages,
- visualize results through charts,
- export data for external analysis.
📁 Report formats
Section titled “📁 Report formats”- Tabular - simple list views.
- Summary - grouped with subtotals.
- Matrix - grouped by rows and columns.
- Joined - multiple report blocks side by side.
Pick the format based on the question you need answered, not personal preference.
📈 Salesforce Dashboards
Section titled “📈 Salesforce Dashboards”A dashboard is a visual collection of components powered by reports.
Dashboards are ideal for role-based monitoring because they let teams see KPIs at a glance and drill into source reports when needed.
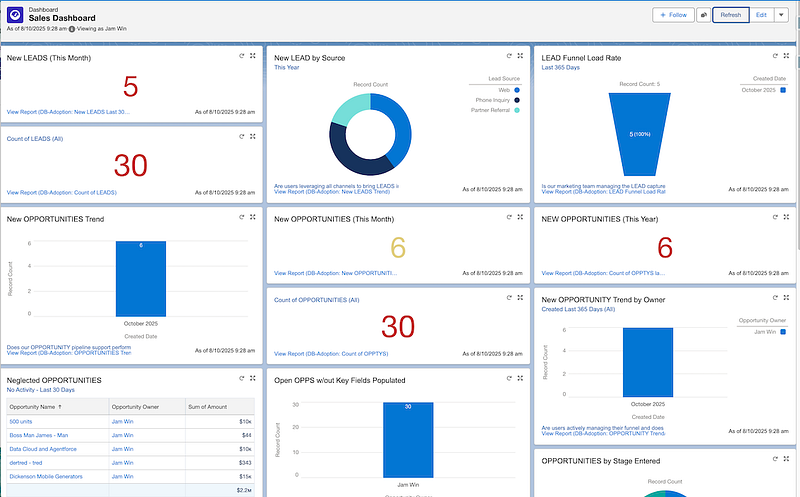
🧩 Dashboard component types
Section titled “🧩 Dashboard component types”- Charts for trends and comparisons.
- Gauges for progress against targets.
- Metrics for single headline numbers.
- Tables for ranked details.
🛠️ Build Workflow: From Question to Dashboard
Section titled “🛠️ Build Workflow: From Question to Dashboard”- Define the business question first.
- Build or refine the source report.
- Add focused dashboard components.
- Validate with real users.
- Tune filters and folder access.
This keeps analytics useful and prevents “dashboard sprawl.”
⭐ Best practices
Section titled “⭐ Best practices”- Performance: keep report scope focused and avoid unnecessary columns.
- Clarity: prioritize the most important metrics first.
- Governance: use consistent folder structures and sharing.
- Maintenance: document report purpose and ownership.
🎯 Final Thoughts
Section titled “🎯 Final Thoughts”Reports and dashboards are where Salesforce proves its value to the wider business. When the right people can see the right metrics at the right time, Salesforce becomes more than a place to enter data; it becomes a shared view of performance, risk, and opportunity.
🚀 Next steps
Section titled “🚀 Next steps”That trust depends on the quality of the data underneath. In Data Management, you’ll learn how to keep Salesforce clean, consistent, and reliable so the reports, dashboards, automation, and future development work all rest on information people can believe.