Mastering Salesforce Administration: Part 1 - Org Health & Monitoring
Published 26/09/2025

In the Fundamentals chapters we covered the platform foundations: orgs and editions, users and permissions, the data model, and your first steps with automation and reporting. With that grounding in place, we now move into the administration track.
This article opens the track with org health and monitoring: the practice of keeping your org predictable before you customise, automate, or deploy. You’ll learn to assess your security posture, surface technical debt, review login activity, track storage and API consumption, and catch failing jobs and automation errors before they become incidents. A well monitored org makes every step that follows easier and safer to deliver.
🩺 Org Health & Monitoring
Section titled “🩺 Org Health & Monitoring”🤔 Why Org Health Matters
Section titled “🤔 Why Org Health Matters”When you start with an existing Salesforce org, whether as a new admin, a developer, or a consultant, you inherit everything that came before you. Every unused field, every overlapping permission set, every “temporary” automation that quietly became permanent. . A well maintained org is a pleasure to work in: changes behave predictably, deployments succeed, and users trust the data. A neglected one is the opposite.
Org health affects everyone on the platform. Redundant metadata clutters the UI and slows down the system. Poorly designed automation creates conflicts that are difficult to diagnose. Storage limits tend to surface at the worst possible moment. Security gaps introduce risks that are far more expensive to fix after something goes wrong.
Monitoring isn’t just housekeeping, it’s how you stay ahead of problems instead of reacting to them. The tools in this section take minutes to run and can reveal issues that would otherwise take hours to debug. Building a habit of regular review is one of the simplest and most valuable practices you can adopt, regardless of your role.
The mindset shift: Great Salesforce professionals don’t wait for users to report problems. They check proactively, catch drift early, and keep the org in a state where everyone can do their best work.
🛡️ Security Health Check
Section titled “🛡️ Security Health Check”Security Health Check is Salesforce’s built‑in security dashboard that gives you an instant snapshot of how your org’s configuration measures up against a defined security baseline. It produces a score from 0–100, groups your settings by risk level, and shows exactly where your org deviates from best practice.
Navigate to: Setup → Quick Find → Health Check
It works by comparing your org’s active settings against a baseline; either the Salesforce Baseline Standard (Salesforce’s recommended configuration) or a custom baseline your organisation defines to meet specific compliance or industry requirements. Because the score depends on the chosen baseline, only compare scores when the same baseline is in use.
Health Check then produces a prioritised list of settings that need attention, grouped into four risk categories:
- High — Significant security exposure; address promptly
- Medium— Deviates from best practice; lower immediate risk
- Low — Minor deviations to review over time
- Informational — Does not affect the score but still worth noting
What Health Check Actually Tells You
Section titled “What Health Check Actually Tells You”For each security control such as password policies, session timeouts, clickjack protection, TLS version requirements, and API access settings, Health Check shows your current org value, the baseline value, and whether the difference is considered a risk. This makes it easy to understand not just what is flagged, but why.
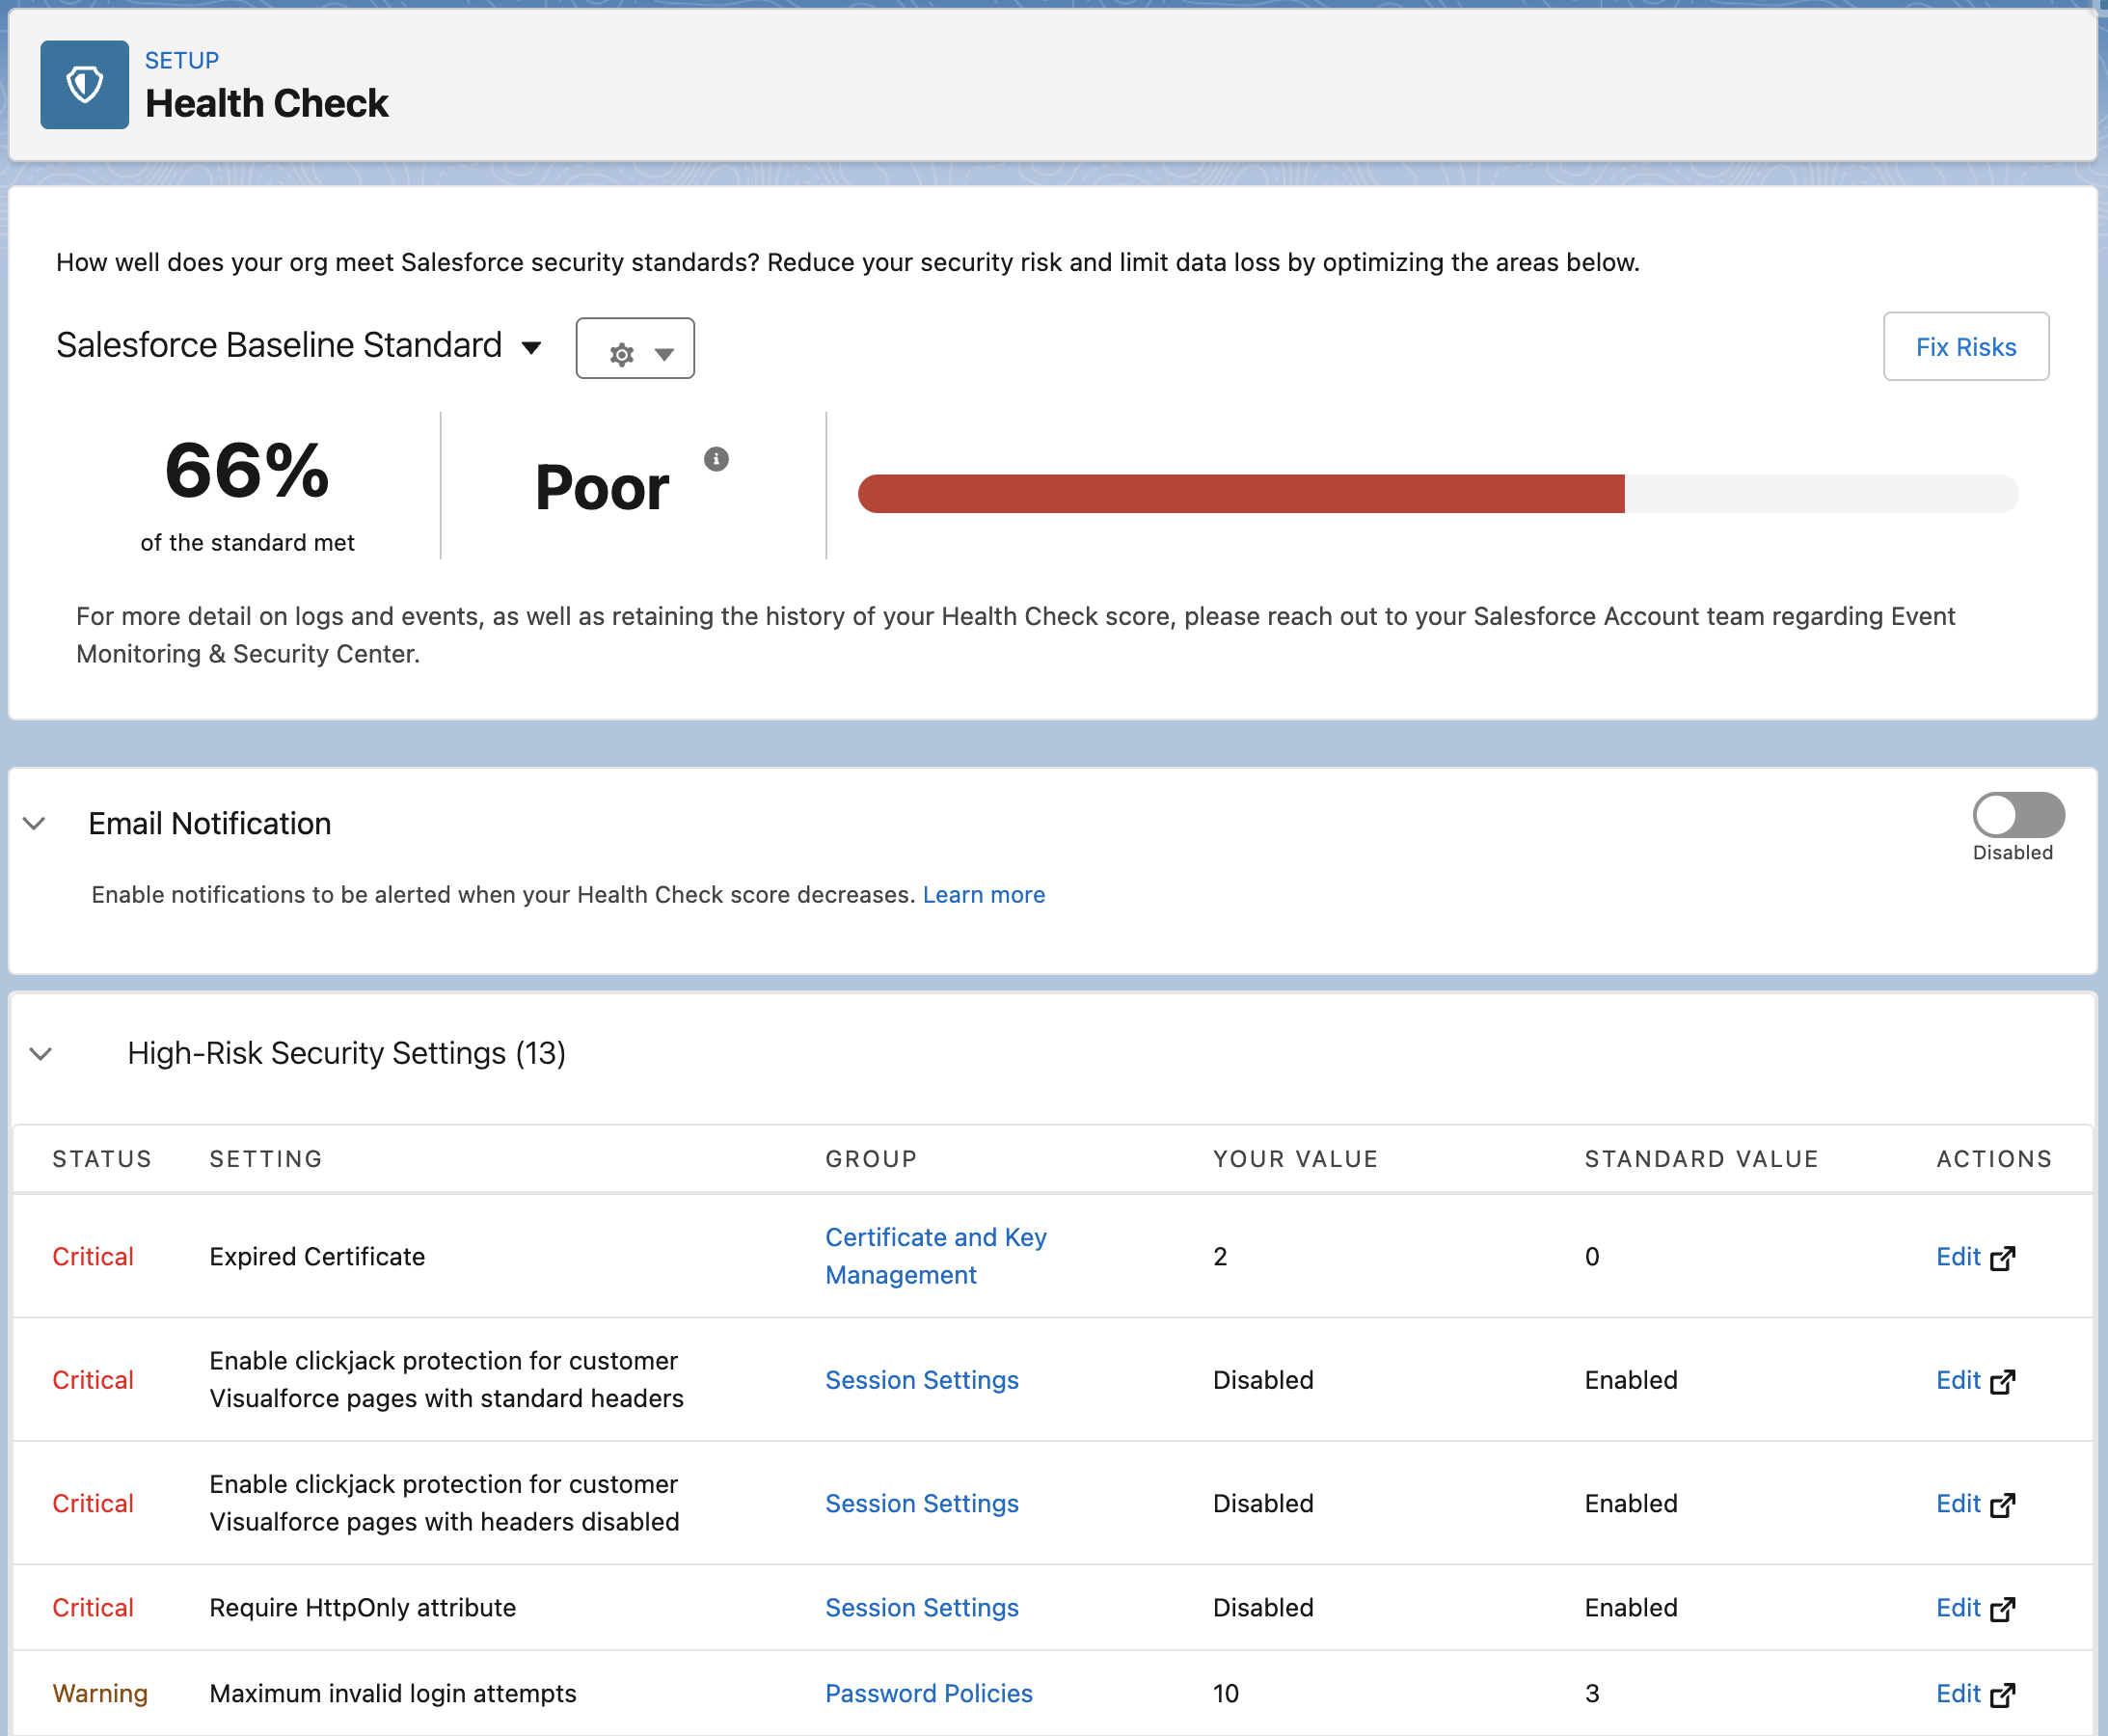
At a glance, you can see:
- Overall score — a numeric measure of alignment with the chosen baseline
- Risk severity counts — how many High, Medium, and Low items exist
- Per‑setting detail — current value vs recommended value for every evaluated control
- Fix Risks shortcut — a one‑click option to apply baseline values automatically across multiple settings
Use Fix Risks with caution. It’s convenient, but applying baseline values automatically can change session timeout lengths, password policies, and other settings that affect every user in your org. Always review changes in a sandbox first before applying them in production.
How to Run Health Check Safely
Section titled “How to Run Health Check Safely”Running Health Check is simple; the real value comes from applying its recommendations in a controlled, predictable way. These steps give you a safe, repeatable process that avoids surprises and keeps your org stable.
-
Start in a Sandbox
Health Check itself is harmless to view, but changing settings can impact users and integrations. Reviewing everything in a sandbox first gives you room to experiment and learn before making decisions that affect the live environment. -
Capture a baseline. Before adjusting anything, record your starting point by exporting the Health Check CSV, taking a screenshot of the overall score, and noting which baseline is being used. This gives you a clear reference for audits, rollback, and tracking improvements over time.
-
Prioritise high‑risk items. Not every finding needs immediate attention. High‑risk items are the ones that meaningfully strengthen your security posture, so they’re the best place to start. Medium‑risk items can follow, while low‑risk and informational items can be reviewed when time allows.
-
Review each setting carefully. Even recommended changes can alter behaviour. Some settings affect session lengths, password resets, or login requirements; others influence integrations through API access or TLS requirements. It’s also worth checking whether your organisation has compliance rules that intentionally differ from Salesforce’s defaults. Understanding the impact of each change is key to avoiding surprises.
-
Treat “Fix Risks” with caution. Fix Risks can apply multiple recommended settings at once, which is convenient but potentially disruptive. It can shorten session timeouts, enforce stricter password policies, change clickjack protection, or modify API and TLS requirements. Always test these changes in a sandbox and apply them individually in production so you can monitor their impact.
-
Roll out changes gradually in production. Once you’ve validated the adjustments, apply the most important fixes first, communicate anything that affects users, and make changes during low‑impact windows. After each batch, re‑run Health Check to confirm that the score and risk profile have improved as expected.
-
Make it a routine. A monthly quick scan and a deeper quarterly review help you catch drift early and keep your org secure, predictable, and easy to build on.
🔍 Org Check
Section titled “🔍 Org Check”Org Check is an open‑source, AppExchange available tool from Salesforce Labs that gives you a dynamic, interactive view of the technical debt that naturally accumulates in any active org. It runs directly inside your org and analyses unused metadata, overlapping permissions, redundant configuration, and structural complexity, with drill‑down detail behind every finding.
What Org Check Analyses
Section titled “What Org Check Analyses”Org Check evaluates four broad areas of your org:
Data Model
Section titled “Data Model”Analyses every standard and custom object including the associated fields, page layouts, record types, and validation rules and flags unused or redundant metadata cluttering your schema.
Automation
Section titled “Automation”It reviews all Flows across your org, highlighting active vs inactive automations and surfacing complexity that may affect performance. It also identifies any remaining Workflow Rules or Process Builder automations, making it easy to spot legacy automation that should be migrated to Flow.
User Interface
Section titled “User Interface”It analyses Lightning pages, components, layouts, tabs, and custom apps. It identifies page layouts that exist but are never assigned, and highlights Lightning pages with unused or redundant components, helping you keep the UI lean and maintainable as your org grows.
Users & Permissions
Section titled “Users & Permissions”This is the most comprehensive section. For active internal users it shows which critical system permissions they hold, including API Enabled, Modify All Data, and View All Data. This makes over privileged accounts easy to spot. Profiles and permission sets are analysed in full detail, including assignment status, CRUD and FLS configuration, and critical permissions. An object permission matrix shows CRUD access across all objects per profile and permission set, and a field-level security matrix lets you drill into any specific object. The role hierarchy is visualised as a dependency tree with colour coding to show which roles have active users and which are empty placeholders ready to be cleaned up.
Org Check vs Health Check
Section titled “Org Check vs Health Check”These tools are complementary, not competing:
| Health Check | Org Check | |
|---|---|---|
| Focus | Security configuration | Technical debt & metadata |
| Source | Native Salesforce (Setup) | Free AppExchange install |
| Output | Security score + risk list | Interactive drill down reports |
| Best for | Security posture review | Structural cleanup & impact analysis |
Run both regularly — Health Check for your security posture, Org Check for everything else.
Note: Org Check is a Salesforce Labs product; free, opensource, and community supported. It is not an official Salesforce product and Salesforce Support is not available for it.
🕵️ Setup Audit Trail
Section titled “🕵️ Setup Audit Trail”Setup Audit Trail is a native Salesforce tool that records configuration changes made in Setup or deployed into the org. It shows who made the change, what they changed, and when it happened. It’s your primary source of truth for understanding how your org has evolved over time and for investigating unexpected behaviour after a deployment or configuration update.
Navigate here: Setup → Quick Find → View Setup Audit Trail
What It Tracks
Section titled “What It Tracks”Setup Audit Trail captures a wide range of configuration changes. Some examples include profile and permission set updates, changes to sharing settings and organisation‑wide defaults, Flow activations and deactivations, custom field and object creation or deletion, user record changes such as role or profile updates, installed or uninstalled packages, and updates to Single Sign‑On or authentication settings.
What You Can See
Section titled “What You Can See”The live view in Setup shows the 20 most recent changes. For a broader picture, you can download the log as a CSV, which provides up to 180 days of change history in a format you can filter, sort, and share.
It’s important to note that Audit Trail is a rolling window, not a permanent archive. Anything older than 180 days is not retained. If your organisation needs long‑term audit history for compliance, you should export and archive the log regularly.
Each entry includes the date and time of the change, the user who made it, the section of Setup where the change occurred, and a plain‑language description of exactly what was changed.
What It Doesn’t Track
Section titled “What It Doesn’t Track”Setup Audit Trail records configuration changes, not data changes. If a user edits a record, that doesn’t appear here. For field level data change history on records, that’s handled by Field History Tracking, a related but separate feature.
When to Check It
Section titled “When to Check It”You’ll use Setup Audit Trail most often after deployments, when users report unexpected behaviour, during admin or developer offboarding, and as part of your regular org health review.
👤 Login History & User Monitoring
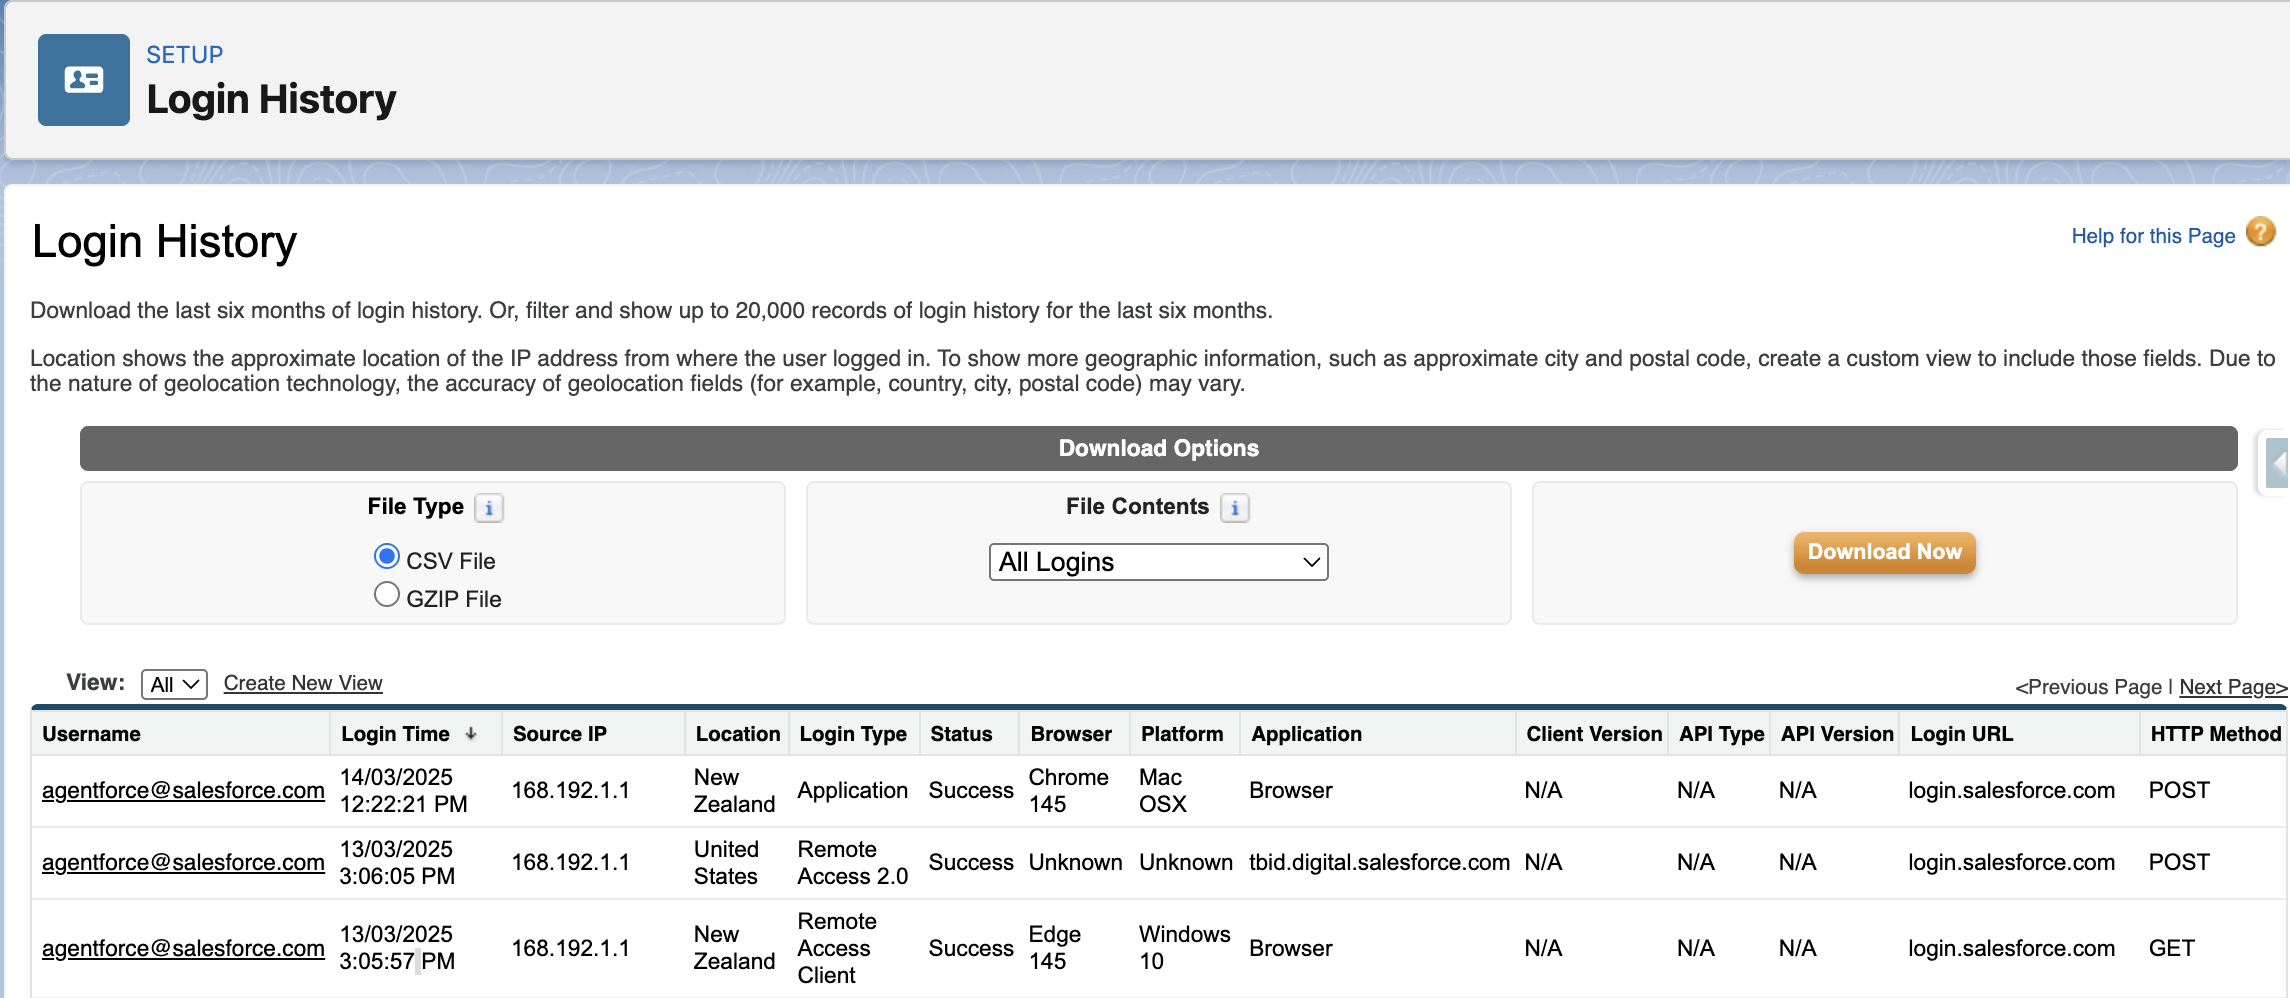
Section titled “👤 Login History & User Monitoring”Login History is a native Salesforce tool that records every login attempt to your org; successful or failed. It shows who tried to log in, when, from where, and how. For any org with real users and real data, reviewing login activity regularly is a simple but important security and administration habit.
Navigate here: Setup → Quick Find → Login History
What It Tracks
Section titled “What It Tracks”Each entry shows the username, whether the login succeeded or failed, the date and time of the attempt, the originating IP address, the login type (username/password, SSO, API, or Lightning), and the client used (browser, Salesforce mobile app, Data Loader, or another tool). Failed attempts include a plain‑language status such as Invalid Password or IP Restricted.
If you only need to review activity for a specific user, you can also access their individual login history directly from their User record.
What to Look For
Section titled “What to Look For”Login History becomes far more useful once you know the patterns worth paying attention to. A sudden spike in failed login attempts for a single user may indicate a brute‑force attempt or simply a locked‑out user who needs help. Logins from unfamiliar IP addresses or unexpected regions are worth investigating, especially for admin accounts. API or Data Loader logins from users who shouldn’t be performing bulk operations are another signal to follow up on.
Limitations to Know
Section titled “Limitations to Know”Login History retains data for six months. It’s a rolling window, not a permanent archive. If your organisation has compliance requirements around access logging, export and archive the data regularly.
Login History also only shows authentication events, it tells you someone logged in, not what they did once inside. For a full picture of user activity, Login History works alongside Event Monitoring (an additional licensed feature) which captures page views, report exports, API calls, and more.
When to Check It
Section titled “When to Check It”Check Login History after a security incident or suspected unauthorised access, when deactivating a user to confirm their last login and whether active sessions need clearing, during regular org health reviews to identify dormant accounts still consuming licences, and whenever a user reports being locked out so you can quickly see the failed attempts and their source.
📦 Storage & Limits
Section titled “📦 Storage & Limits”Salesforce orgs have defined limits on data storage, file storage, and API usage. These limits don’t announce themselves, and the consequences of hitting them vary. A storage limit is a hard stop that prevents record saves and imports outright, while API limits are more nuanced, behaving as soft thresholds in production orgs before a hard system cap kicks in above them. What they share is that none of them give you much warning. Understanding what limits exist and how to monitor them before they become a problem is a core admin responsibility.
Navigate here: Setup → Quick Find → Storage Usage
The Three Limits to Watch
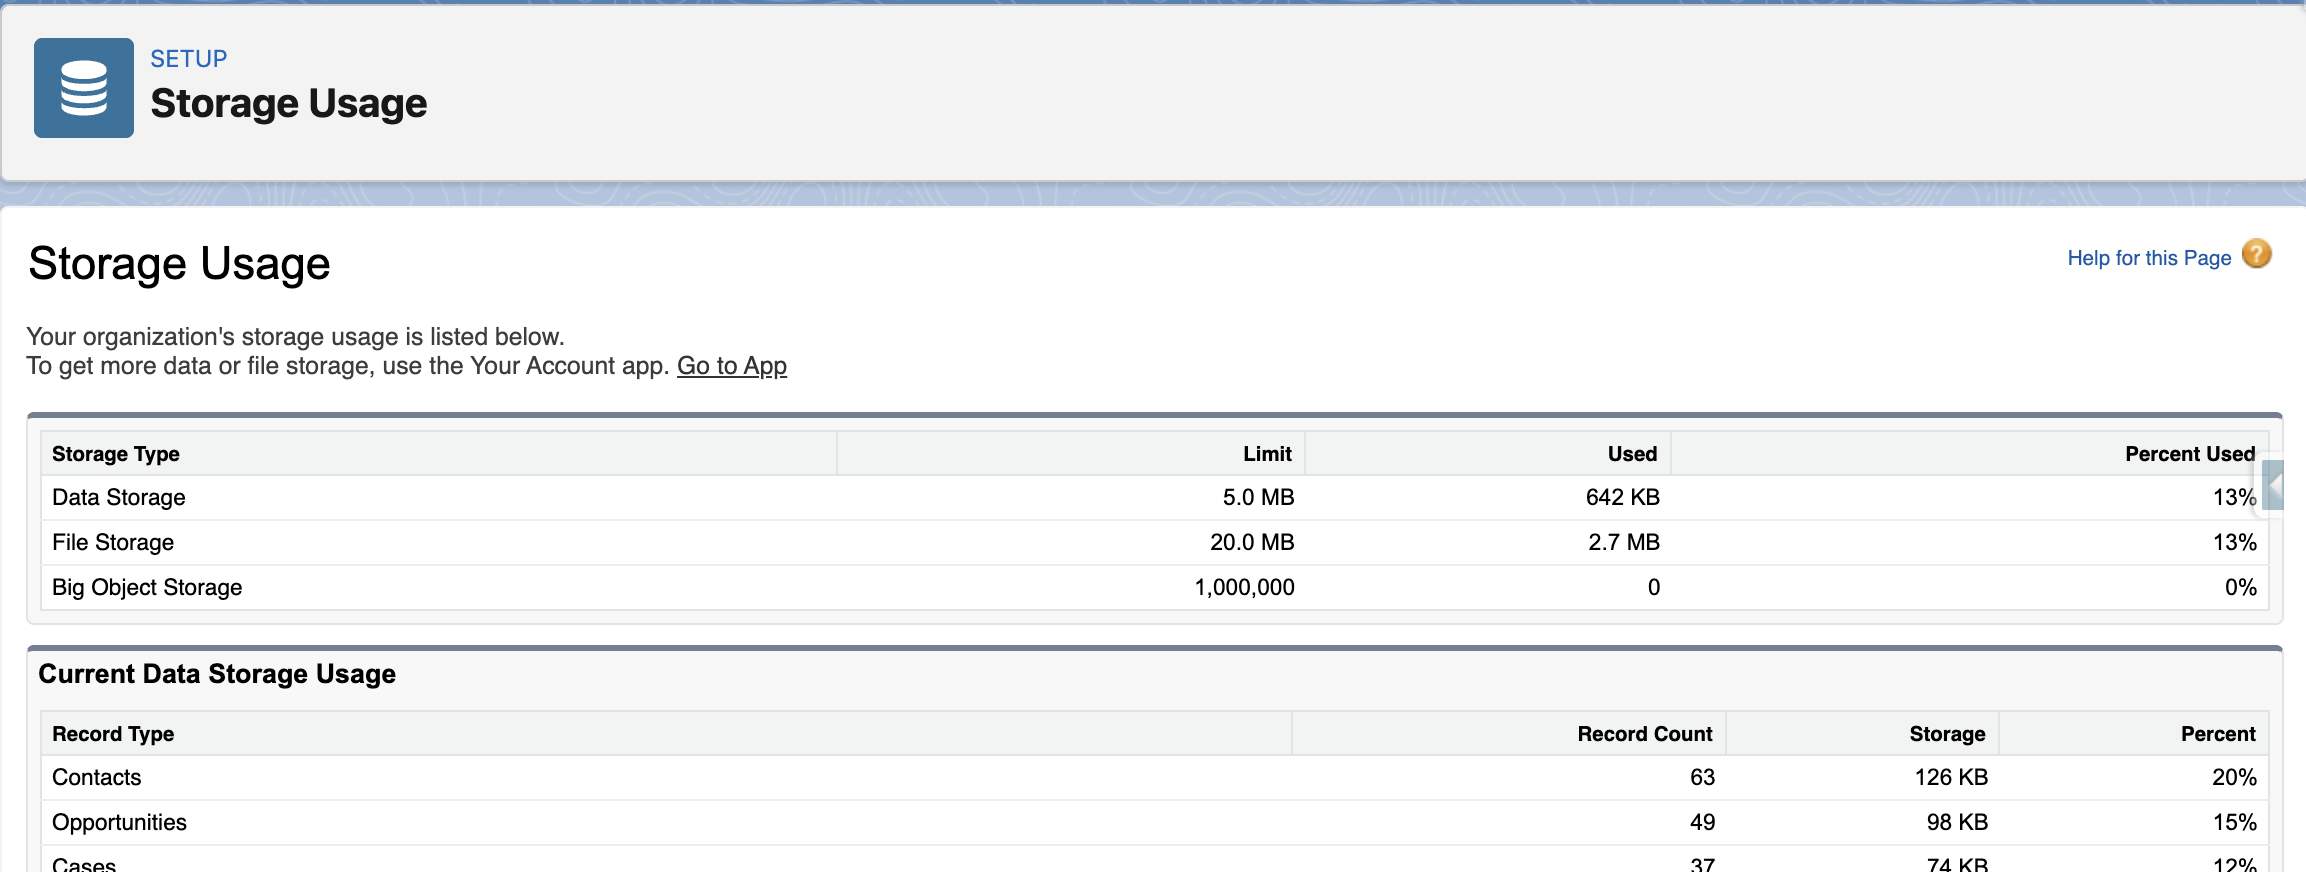
Section titled “The Three Limits to Watch”Data storage
Section titled “Data storage”Measured in MB or GB depending on your edition and is consumed by every record in your org, standard and custom objects alike. Orgs can hit this limit without warning, especially those that have been running for years without archiving or cleanup, or after a large data migration.
Data storage is calculated per record, not per field, so even objects with many empty fields still consume the same storage as one with hundreds of fields filled in. This often surprises teams who assume “lightweight” records take up less space.
For extremely large datasets that don’t need frequent updates, Big Objects provide a separate storage limit from standard objects, giving you a way to retain high‑volume data without consuming your org’s normal data storage allocation. They require developer setup and aren’t a drop‑in replacement for standard objects, but they’re useful for long‑term, queryable storage.
File storage
Section titled “File storage”File storage is separate from data storage and covers attachments, uploaded files, Salesforce Files content, and documents. Large attachments are a common culprit. A single object with a frequently used file upload field can consume storage quickly.
API requests
Section titled “API requests”API requests are counted on a rolling 24-hour basis. Orgs with multiple integrations, scheduled jobs, and heavy automation can approach this limit, especially during busy business periods or after a new integration goes live. Hitting the API limit can cause integrations to fail silently until the window resets.
How to Monitor Storage
Section titled “How to Monitor Storage”The Storage Usage page in Setup gives you a breakdown of data and file storage; total allocation, how much is used, and which objects are consuming the most. It’s worth checking this periodically, and particularly before any large data import or migration.
For API usage, the System Overview page (Setup → Quick Find → System Overview) shows your current API request consumption against your daily limit, along with other org-wide limits such as active Flows, scheduled jobs, and custom objects.
Beyond native Setup tools, there are tools that help you monitor limits including browser extensions such as Salesforce Inspector and Salesforce Inspector Reloaded surface org limits directly in the browser without navigating through Setup menus, which many admins and developers find more convenient during day-to-day work. These tools display storage consumption, API usage, and other key metrics alongside the org you are already working in.
When Limits Become a Problem
Section titled “When Limits Become a Problem”If you hit data storage limits, your options are archiving old records, deleting records that are no longer needed, or purchasing additional storage.
Before deleting records to free storage, consider whether they should be archived externally for compliance, reporting, or audit requirements. Cleanup is important, but so is retaining the right history in the right place.
If you hit API limits, the fix is typically reviewing integration call patterns, batching API requests more efficiently, or upgrading your edition. Neither is a quick fix under pressure, this is why proactive monitoring matters.
🔄 Apex Jobs & Scheduled Jobs
Section titled “🔄 Apex Jobs & Scheduled Jobs”Salesforce can run a lot of work in the background: batch processing, scheduled automation, and queued logic that executes outside of user sessions. Because this work happens behind the scenes, failures don’t surface as visible errors to users or admins. A nightly batch job that cleans up records, syncs data, or generates outputs can fail repeatedly without anyone noticing until the downstream effects become obvious.
Navigate here: Setup → Quick Find → Apex Jobs or Scheduled Jobs
Two Pages, Two Purposes
Section titled “Two Pages, Two Purposes”The Apex Jobs page shows every asynchronous Apex process that has run, is running, or is queued. This includes batch jobs, scheduled jobs, and queueable jobs. It displays status, timing, the number of records processed, and crucially, error details for anything that has failed or completed with issues.
The Scheduled Jobs page shows all jobs configured to run on a recurring schedule, covering everything from scheduled Apex and Flows to dashboard refreshes, reporting snapshots, and scheduled reports. It’s the quickest way to answer “what automated processes are set to run in this org, and when?” without digging through the full Apex Jobs history.
Understanding Job Statuses
Section titled “Understanding Job Statuses”Jobs move through statuses such as Queued, Preparing, Processing, Completed, and Failed. A key detail is that a job can show as Completed even if it encountered errors on individual records. Those errors appear in the Status Details column rather than changing the overall status. Always check Status Details on completed jobs, not just the headline status.
Jobs in a Holding state are sitting in the Apex Flex Queue waiting for capacity. This is normal under load, but worth monitoring if jobs remain there longer than expected.
Error Notifications
Section titled “Error Notifications”Salesforce does not send automatic failure notifications for batch jobs by default, so any alerting must be deliberately set up. You can use Apex Exception Email (Setup → Quick Find → Apex Exception Email) to capture unhandled Apex exceptions org‑wide, or build custom notification logic directly into the batch class.
It is worth confirming this is in place for any business critical scheduled jobs, and that notifications go to someone who can act on them. A related and easily overlooked issue is that scheduled jobs run as the user who originally scheduled them. If that user is deactivated, the job will fail, making staff offboarding a key moment to audit which scheduled automations they owned.
Monitoring apex jobs is covered in the Asyncronous Apex trailhead module but this is very much developer focused and required a good understanding of apex code.
🌊 Flow & Process Automation Errors
Section titled “🌊 Flow & Process Automation Errors”As Flow takes on more of the automation workload in modern orgs, understanding how and where it fails becomes an increasingly important admin skill. Salesforce does send email notifications for unhandled Flow faults, but these go to the running user or default admin and are easy to miss or misconfigure. More importantly, a Flow with no fault path simply stops and surfaces a generic error to the user, leaving no record of what failed or why. Proactive monitoring of the Paused and Failed Flow Interviews page gives you visibility that error emails alone don’t reliably provide.
Navigate here: Setup → Quick Find → Paused and Failed Flow Interviews
Failed Flow Interviews
Section titled “Failed Flow Interviews”When a Flow encounters an error it cannot handle, Salesforce creates a failed Flow interview this is a record of what was running, what triggered it, and where it went wrong. The Paused and Failed Flow Interviews page lists all of these, along with the error message, the Flow version that was running, and the record that triggered it. This is your first stop when a user reports that something didn’t happen as expected and you suspect automation is the cause.
Paused Interviews & Scheduled Actions
Section titled “Paused Interviews & Scheduled Actions”Not everything on this page represents a failure. Paused interviews are Flow instances waiting on a resume condition such as a time based pause element; they are expected, but a large accumulation on a single Flow is worth investigating, as it may indicate a condition that is never being met.
Flows that use scheduled paths or time‑based actions also create pending work that sits in a queue until the scheduled time arrives. You can view and manage all of this at Setup → Quick Find → Time‑Based Automations, which provides a unified view of queued automation across Flows and any remaining legacy workflow rules. This page is useful for confirming that expected automation is queued and for cancelling pending actions when a record has changed and the automation is no longer relevant.
A Note on Process Builder
Section titled “A Note on Process Builder”Many orgs still have active Process Builder automation running alongside or underneath their Flows. Process Builder failures surface in the same Paused and Failed Flow Interviews page, so not every entry you see there will be a Flow. This is particularly common in older orgs that haven’t yet completed a migration to Flow‑first automation.
There is a fun module on Flow troubleshooting that focuses on how to diagnose and fix issues inside an individual Flow. It’s a great hands‑on complement to this section, which takes a broader view by showing you how Flow and Process Builder errors surface across the org, how to monitor them, and how to spot patterns that indicate deeper automation problems.
📡 Salesforce Trust (When Things Go Wrong)
Section titled “📡 Salesforce Trust (When Things Go Wrong)”When something in your org suddenly behaves differently, maybe pages are loading slowly, logins are failing, features are timing out, or integrations dropping; the quickest way to rule out a platform‑wide issue is to check Salesforce Trust.
Trust is Salesforce’s real‑time status and incident site, showing active incidents, maintenance windows, degraded performance, and regional disruptions for your specific instance.
Visit: trust.salesforce.com → Search for your instance (e.g., AP28, NA85, EU44)
Trust gives you what you can’t get from inside your org: a live view of your instance’s health, details on any ongoing incidents, and updates directly from Salesforce on progress and resolution timelines. It’s the fastest way to answer the question every admin hears sooner or later: “Is this us, or is Salesforce having a problem?”
Example: When Trust saves you time
Section titled “Example: When Trust saves you time”A team reports that Lightning pages are taking 10–15 seconds to load across the org. Nothing has changed recently, and multiple users are affected. Before diving into debugging or checking automation, you open Salesforce Trust and see a performance degradation incident listed for your instance with updates already in progress. Instead of spending hours troubleshooting something you can’t fix, you can communicate the issue clearly to users and monitor Salesforce’s updates until service returns to normal.
🧰 Other Things to Monitor
Section titled “🧰 Other Things to Monitor”Monitoring an org goes beyond the headline tools. There are quieter areas worth knowing about, particularly when inheriting an org or diagnosing an issue with no obvious cause.
Named Credentials & Remote Site Settings
Section titled “Named Credentials & Remote Site Settings”These control which external endpoints Salesforce is permitted to communicate with.
Remote Site Settings define the URLs that Salesforce can make callouts to. If an endpoint URL changes or a new integration is being set up, a missing or incorrect remote site entry will block the callout entirely.
Named Credentials provide a secure way to define callouts by storing the endpoint and its authentication details together. When a Named Credential handles authentication, Salesforce waives the remote site setting requirement for that endpoint.
Legacy Named Credentials store authentication directly in the credential. External Credentials are the updated approach, separating the authentication protocol and principal details from the Named Credential itself, making it easier to manage across multiple users or permission sets. If an integration stops working, it’s worth checking whether the underlying External Credential still has valid authentication. An OAuth token may need reauthorising or credentials that have been rotated on the external system.
Navigate here: Setup → Quick Find → Remote Site Settings or Named Credentials
Certificates
Section titled “Certificates”These are used to authenticate outbound calls and secure integrations. They have expiry dates, and Salesforce sends email notifications to system administrators at 60, 30, and 10 days before expiry, and again on the day itself. By default these go to all users with the System Administrator profile, though you can narrow this by assigning the Receive Certificate Expiration Notifications permission to specific users.
Keeping an eye on which certificates are in use and when they expire is worth building into your regular org health review. An expired certificate will silently break any integration, SSO configuration, or Connected App that depends on it.
Navigate here: Setup → Quick Find → Certificate and Key Management
Email Deliverability
Section titled “Email Deliverability”This controls whether your org can send outbound emails. It is sometimes set to System Email Only in sandboxes and inadvertently left that way when the org is promoted or cloned. If users or automations are reporting that emails aren’t being sent, this is one of the first places to check.
Navigate here: Setup → Quick Find → Deliverability
Lightning Usage App
Section titled “Lightning Usage App”Provides adoption and performance data. Which pages users visit, how fast they load, and where UI errors are occurring. It is less of a break-fix tool and more useful for identifying performance bottlenecks and understanding how your org is actually being used.
Navigate here: App Launcher → Lightning Usage
🧩 Bringing It All Together
Section titled “🧩 Bringing It All Together”Org health isn’t a single tool or a once‑a‑year activity, it’s a habit. The more familiar you are with the signals your org gives you, the faster you can spot drift, diagnose issues, and keep things running smoothly. The tools in this chapter give you the visibility you need to stay ahead of problems rather than reacting to them. Build a rhythm of checking them regularly, and your org will reward you with stability, predictability, and far fewer surprises.
Next steps
Section titled “Next steps”A healthy org is also the foundation for everything that follows in this admin track. Now let’s continue with Part 2 — Advanced UI customisation, where you will shape Lightning apps, record pages, and the day‑to‑day experience users actually work in.